Diagnostics
DxMessaging emphasizes visibility. You can enable diagnostics globally or per token, inspect recent emissions, page through registrations, view contexts (targets/sources), monitor the global bus, and export a filtered message-flow graph from Unity's editor tools.
DiagnosticsTarget Enum
The DiagnosticsTarget enum is a flags enum that controls when diagnostics are enabled. It allows fine-grained control over which execution environments collect diagnostic data.
| Value | Description |
|---|---|
Off | Diagnostics are disabled in all environments. |
Editor | Diagnostics run only while in the Unity Editor. |
Runtime | Diagnostics run only in player/runtime builds (not the Editor). |
All | Diagnostics run in both Editor and runtime environments. |
Because DiagnosticsTarget is a flags enum, you can combine values:
using DxMessaging.Core.MessageBus;

// Enable diagnostics only in the Unity Editor
IMessageBus.GlobalDiagnosticsTargets = DiagnosticsTarget.Editor;

// Enable diagnostics only in runtime builds
IMessageBus.GlobalDiagnosticsTargets = DiagnosticsTarget.Runtime;

// Enable diagnostics everywhere
IMessageBus.GlobalDiagnosticsTargets = DiagnosticsTarget.All;

// Disable diagnostics completely
IMessageBus.GlobalDiagnosticsTargets = DiagnosticsTarget.Off;
Configuration Toggles
DxMessaging provides multiple levels of diagnostics control:
Global Defaults
IMessageBus.GlobalDiagnosticsTargets-- Sets the default diagnostics mode for newly created buses and tokens. Uses theDiagnosticsTargetflags enum.IMessageBus.GlobalMessageBufferSize-- Sets the default ring buffer size for emission history (default: 100).IMessageBus.GlobalDiagnosticsStackTraces-- Records the call site of every emission. Off by default; see Emission-Site Capture before turning it on.
Per-Bus and Per-Token
IMessageBus.DiagnosticsMode-- Read-only property indicating whether diagnostics are active for a specific bus instance.MessageRegistrationToken.DiagnosticMode-- Controls diagnostics for an individual registration token.
using DxMessaging.Core;
using DxMessaging.Core.MessageBus;

// Configure global defaults before creating buses/tokens
IMessageBus.GlobalDiagnosticsTargets = DiagnosticsTarget.Editor;
IMessageBus.GlobalMessageBufferSize = 200;

// Check if diagnostics are enabled for a specific bus
IMessageBus bus = MessageHandler.MessageBus;
if (bus.DiagnosticsMode)
{
    Debug.Log("Diagnostics are active on this bus.");
}
Project Settings
The package registers a UI Toolkit Project Settings page under Project Settings > Wallstop Studios > DxMessaging. Use it to set the same project-wide defaults without writing bootstrap code:
- Diagnostics Targets -- the
DiagnosticsTargetflags enum. - Message Buffer Size -- the default diagnostics ring-buffer size.
- Suppress Domain Reload Warning -- editor-safety warning control.
- Base-Call Check Enabled and Use Console Bridge -- Inspector warning controls for missing
MessageAwareComponentbase calls.
The ignore list for base-call warnings still lives on Assets/Editor/DxMessagingSettings.asset. See the Inspector Overlay & Base-Call Warnings guide for the field-by-field Inspector behavior.
Editor Tools
The Inspector remains useful for the selected MessagingComponent, but the current editor tooling also includes two dedicated windows under Tools > Wallstop Studios > DxMessaging.
Message Monitor
Open Tools > Wallstop Studios > DxMessaging > Message Monitor to inspect the default global bus. The window has two modes, and a badge in its toolbar always says which one is showing:
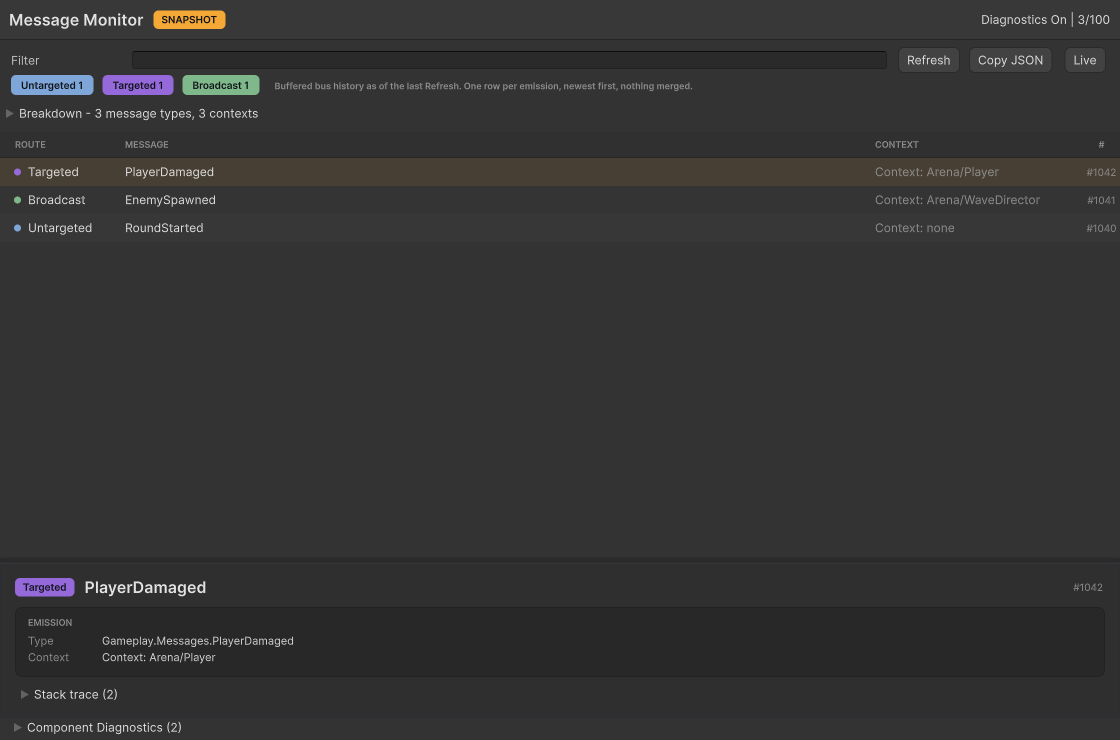
- SNAPSHOT reads the buffered bus history as of the last Refresh. One row per emission, newest first, nothing merged.
- LIVE streams new emissions as they happen. Repeats of the same message and context merge into one row, and the
Ncolumn counts them.
The badge is also the switch: click SNAPSHOT to go live and LIVE to go back. Live mode keeps its Snapshot button beside the badge as well.
Both modes show a fixed-height row per emission with the route kind, the message type and the context. Snapshot ends the row with the dispatch id; live ends it with the time the row was observed and the N count of emissions merged into it. Selecting a row fills the detail pane below the log; the stack trace lives there behind a disclosure that starts closed, so a long call stack never buries the log itself. When emission-site capture is off the disclosure starts open instead, says so, and offers the switch -- see Emission-Site Capture.
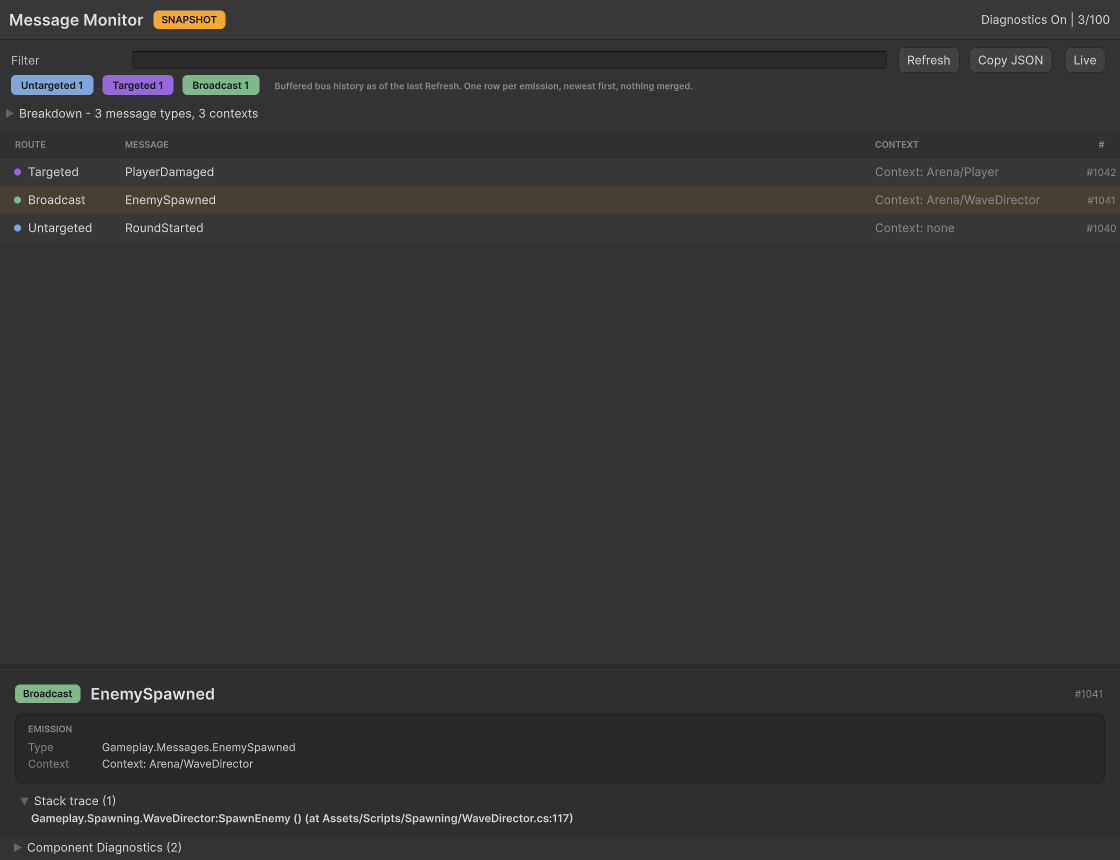
The detail pane links out to what a row stands for:
- Type carries an Open source button when the declaring file can be found.
- Context selects and pings its object in the Hierarchy while that object is still alive, and stays readable but inert once it is gone.
- Stack trace is one row per frame, each with its own Open button when the frame names a file and line. Unity's own stack-capture frames are left out, and the first row is the emitting call site.
Anything that answers a click shows the pointer cursor. Drag the divider between the log and detail pane to resize the complete lower area; the window remembers that height across filtering, mode changes, reloads, and reopen. Component Diagnostics keeps its own drag handle because it is a separate disclosure. Stack frames use their full wrapped line height and scroll with the rest of the detail pane.
Changed in v3.3.0
The log and complete detail pane now share one remembered divider. Stack frames keep their full wrapped height inside the detail pane's scroll area.
Three taxonomy chips, one per route kind, name their kind and are drawn in the color that marks it in every row, so the chips are both the color legend and the per-kind filter. Clicking one hides or shows its route kind. In snapshot mode they sit above the log and each carries how many matching entries it stands for; in live mode they sit in the toolbar without a count, because the log is still filling.
The same taxonomy applies across Message Monitor, Flow Graph, the documentation, and shipped artwork: blue marks Untargeted, purple marks Targeted, and green marks Broadcast. Red is reserved for problems such as a live-log gap notice.
The text filter keeps plain text matching and also supports complete whitespace-separated field facets backed by captured entry data: type:, message:, context:, and stack:. Facet terms can be combined, for example type:Damage context:Player. Quote typed values with spaces, for example context:"Context: Player"; unquoted values with spaces stay on the plain text path. The active filter strip shows whether the current filter is typed or plain text and provides a Clear action without changing JSON export. Copy JSON copies exactly the entries the log is showing, chips included.
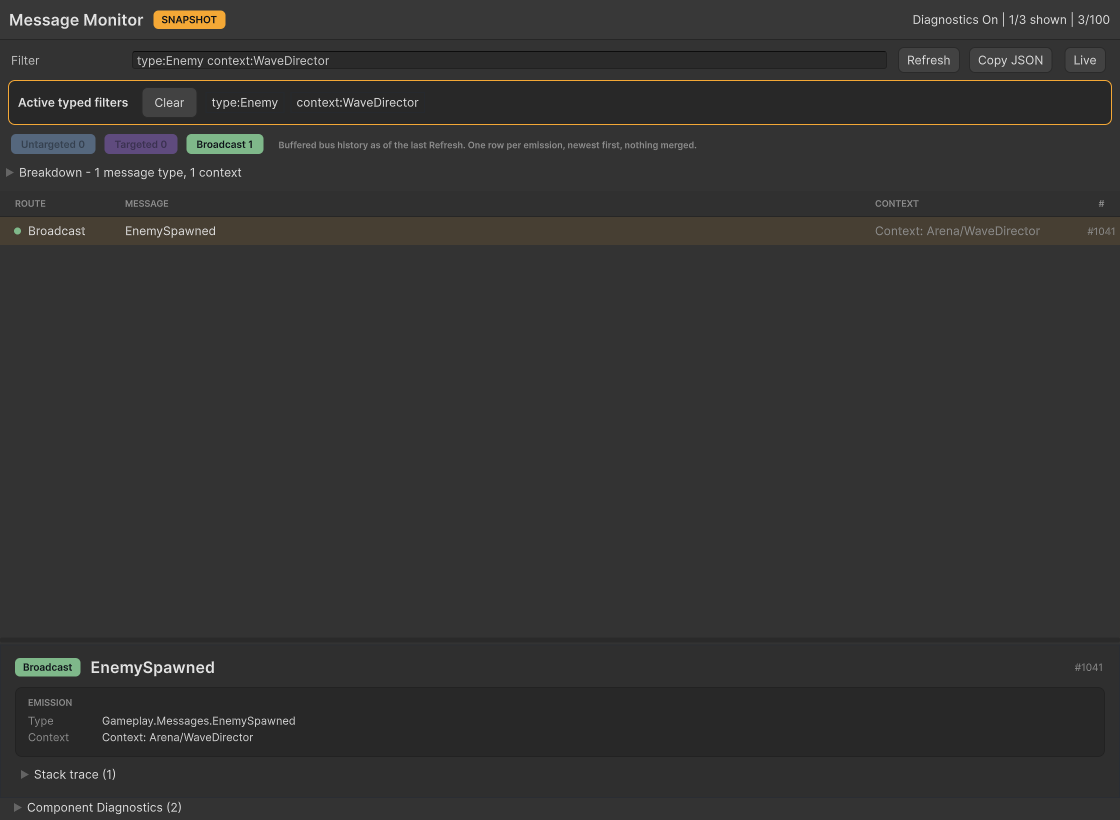
This example combines type:Enemy context:WaveDirector with the Untargeted and Targeted chips disabled. The active-filter strip keeps both parsed terms visible, and the log and JSON export contain only the remaining Broadcast row.
Breakdown is a collapsed disclosure holding one clickable pill per message type and per context in the visible log. Each pill shows its share of the log and applies the filter that isolates it: message-type pills apply a type: filter, and context pills apply a quoted exact context: filter. The counts behind a pill, and the contexts or message types it covers, are in its tooltip.
Component Diagnostics, also a collapsed disclosure, summarizes loaded scene MessagingComponent instances without resolving serialized providers. It shows listener counts, enabled/diagnostics listener counts, registrations, call counts, local message counts, provider status, and provider warnings such as a missing serialized provider or a provider that resolves no bus.
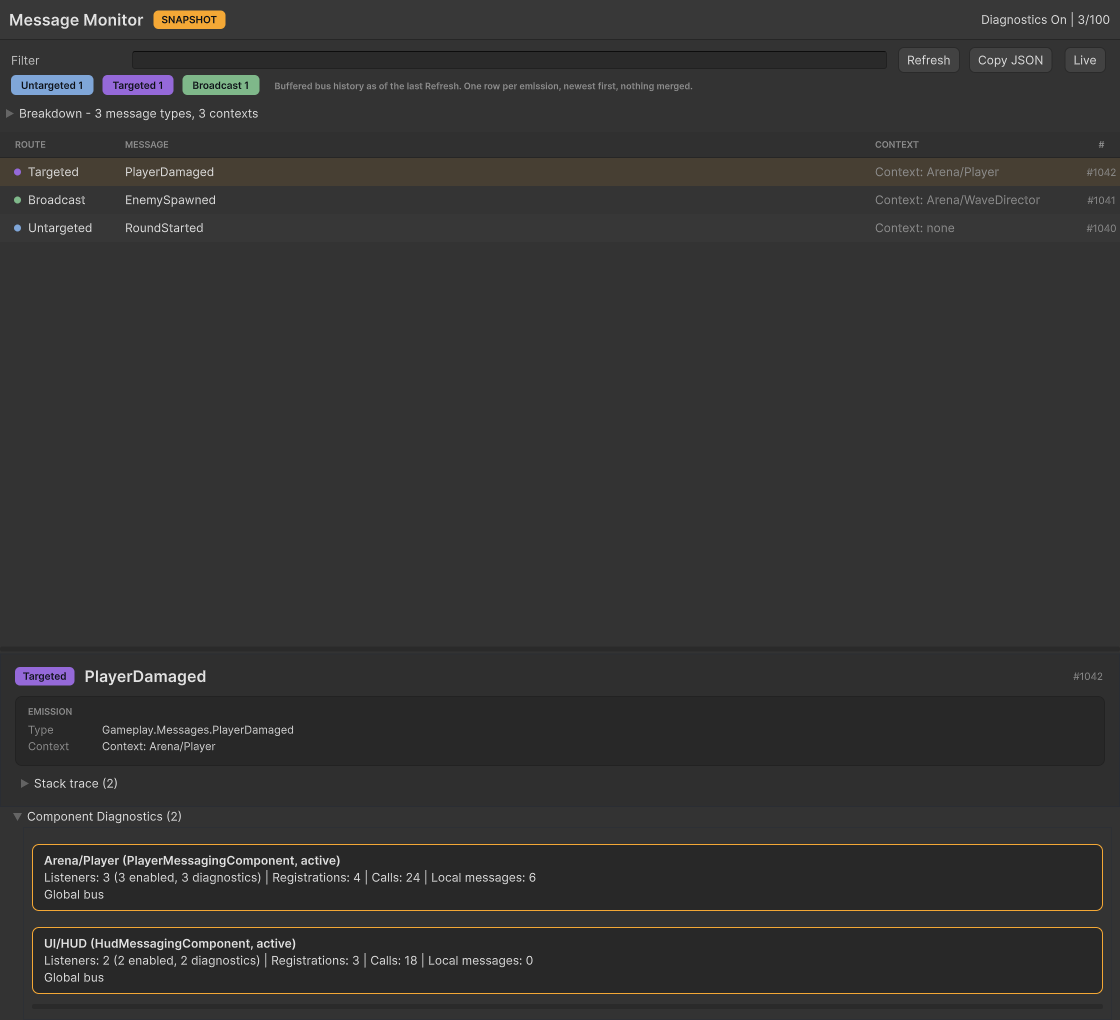
If the active global bus is not the default concrete DxMessaging MessageBus, the message list reports that it is unavailable. Component diagnostics still use safe editor capture and avoid mutating provider state.
Flow Graph
Open Tools > Wallstop Studios > DxMessaging > Flow Graph to inspect loaded scene MessagingComponent registration topology. The primary surface is an interactive graph: message nodes occupy the left column, receiver nodes occupy the right column, and arrowheads carry direction without placing text labels on the lines. The layout alternates crossing-reduction sweeps across both columns, then orders each node's connection ports by the opposite column. Small shape-and-color route selectors identify registration kinds, while the full feathered curve accepts clicks through a generous hit corridor. Select a route near either endpoint or between crossings; the selected path stays bright while unrelated paths dim. Nodes use named metric rows instead of compact +N summaries.
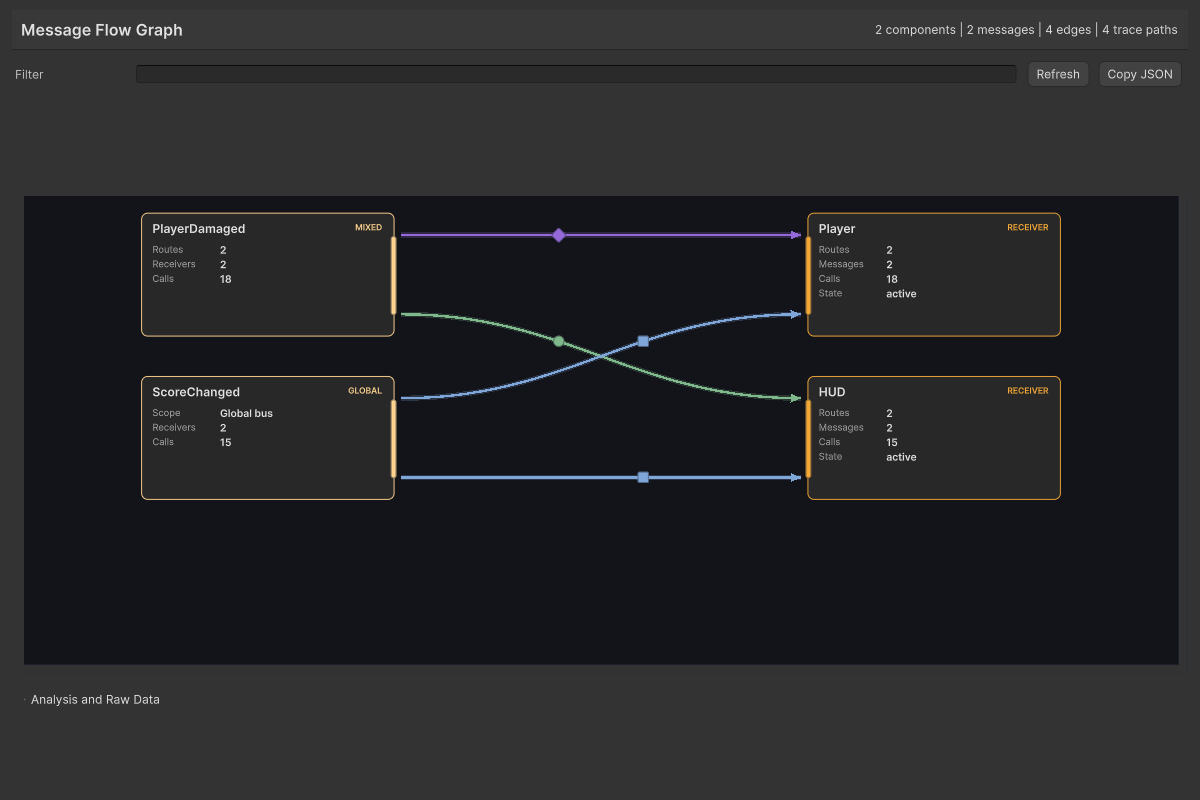
Select the left message/source node, right destination node, or connecting route to open the corresponding evidence pane:
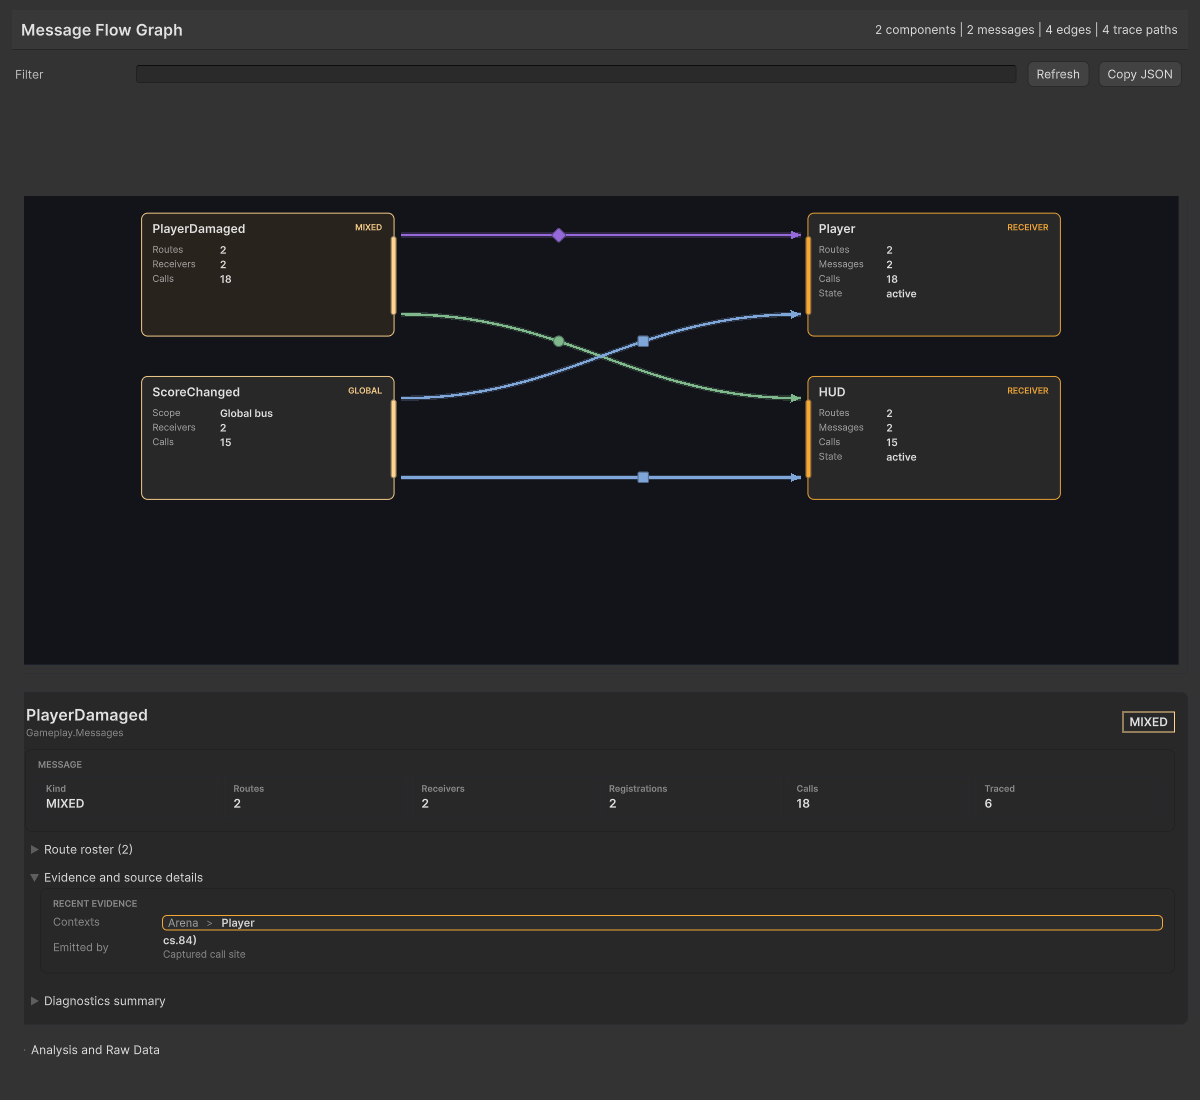
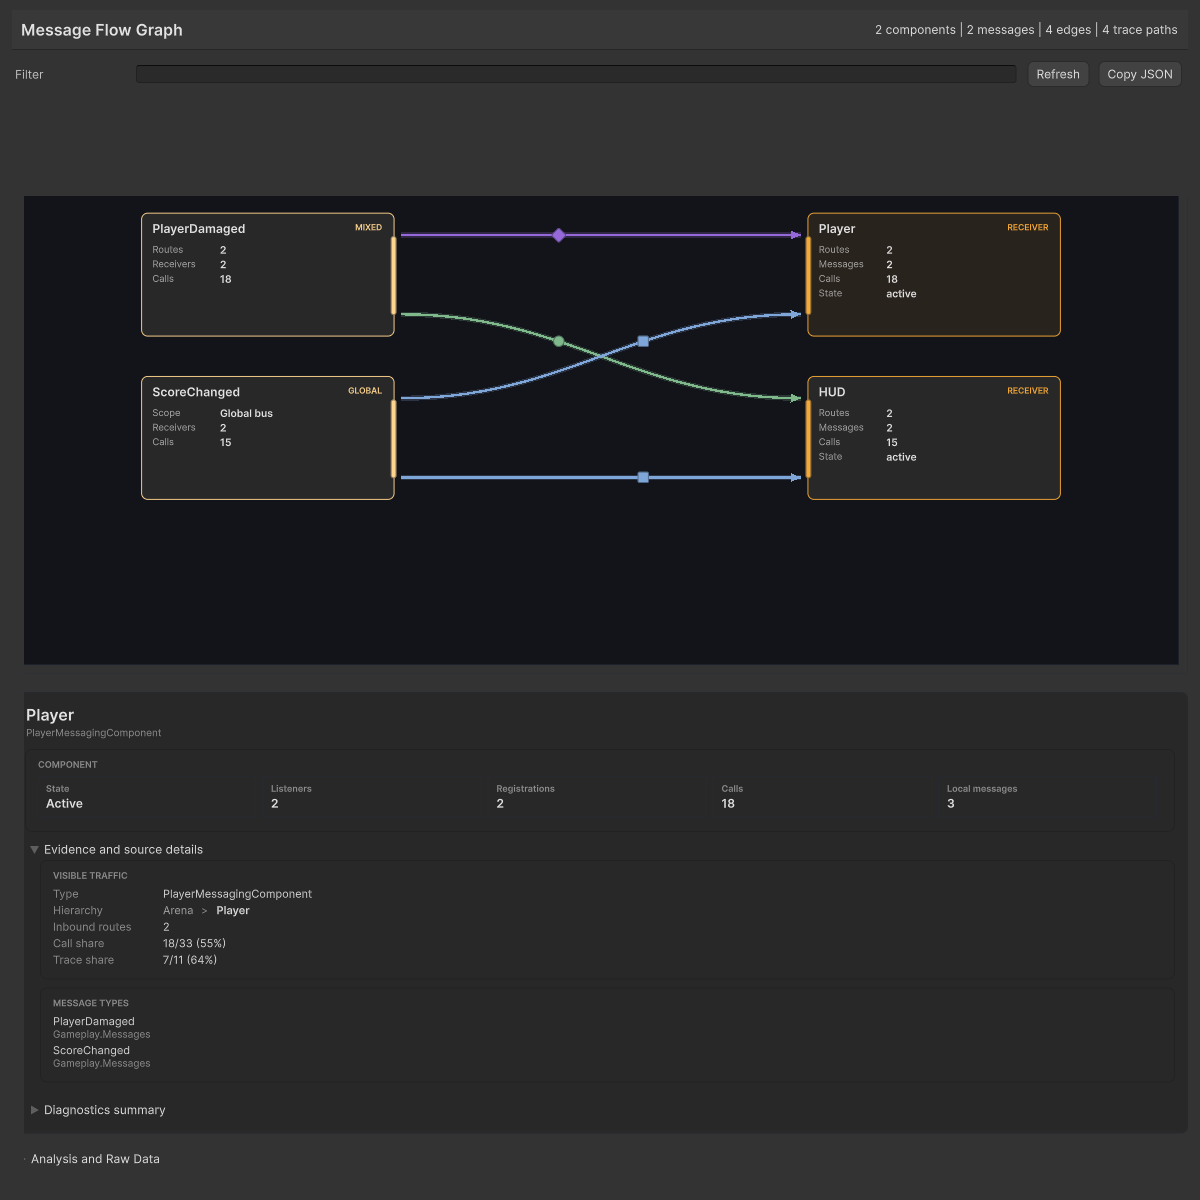
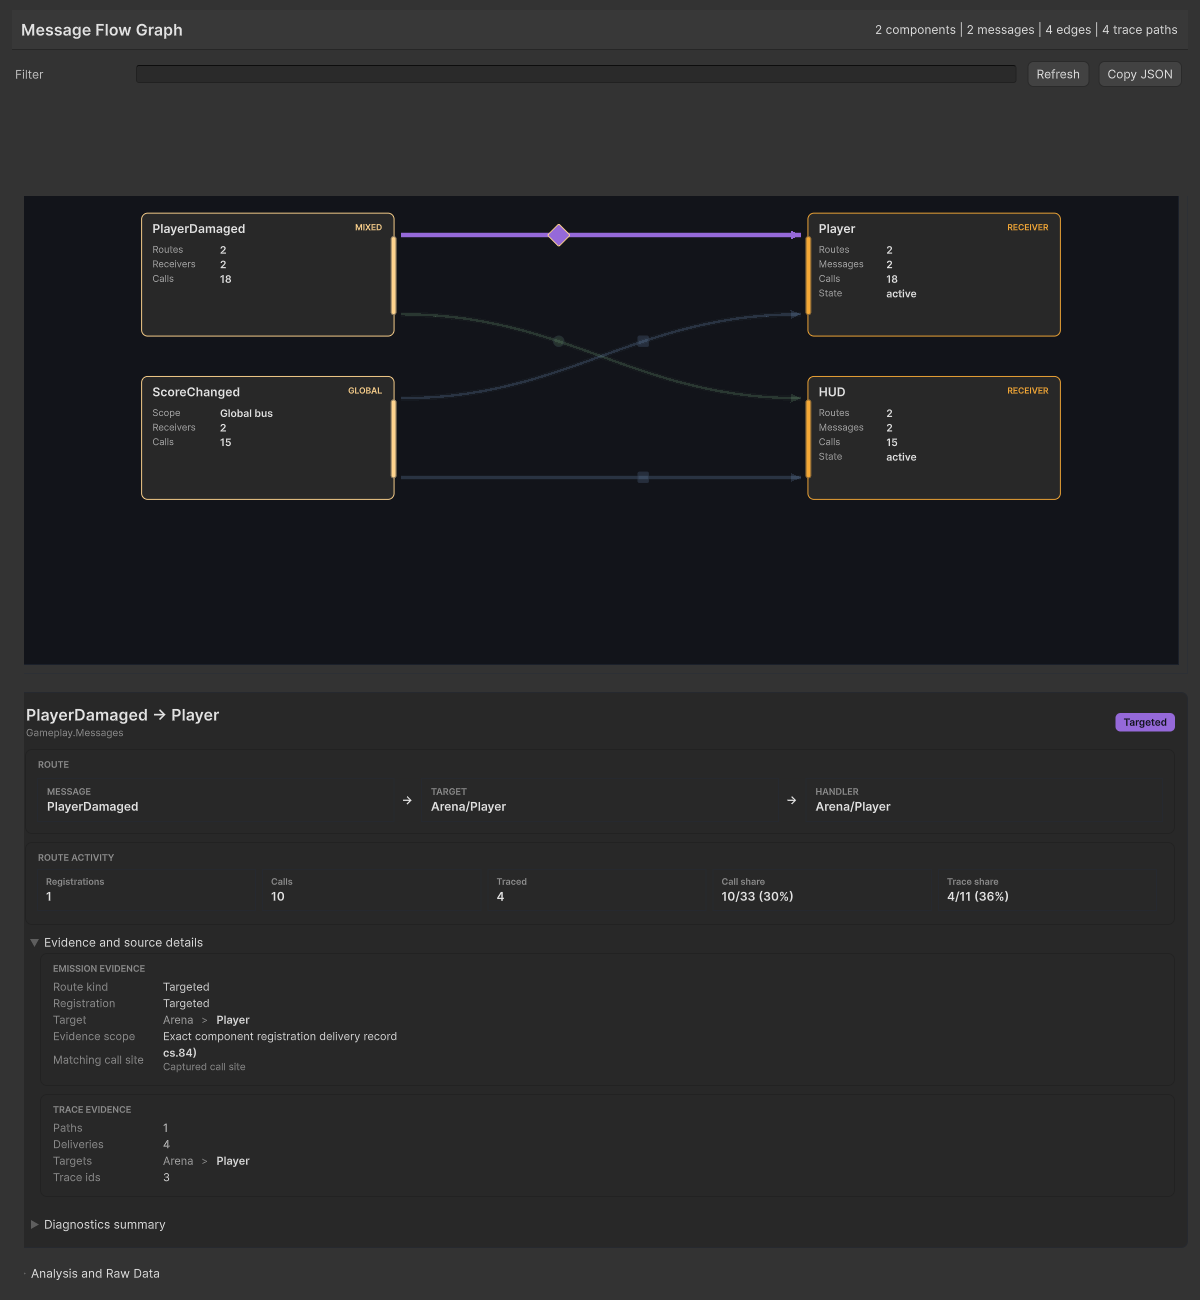
Broadcast nodes identify source scope, targeted nodes identify target scope, and untargeted nodes identify the global bus. A type with more than one visible route kind uses a MIXED node with neutral route, receiver, and call metrics; filtering it to one route kind restores that kind's focused metrics. Targeted and broadcast route details list recent call sites from the exact component registration delivery record when token diagnostics captured them. A call site identifies the emitting script, method, file, and line. Use Open call site to open that exact line. Message and route selections also provide Open message source when Unity can resolve the captured type to its declaration. Component evidence lists each visible message type as a compact row with its full identity in a tooltip and an Open source action when the declaration is available. It shows eight rows before a collapsed remainder so dense receivers do not replace the graph with a long list. Captured object contexts use breadcrumb trails such as World > Combat > Enemy Drone, with the exact captured value in the tooltip. A trail selects its matching graph component when the filtered capture resolves exactly one; unresolved instance fallbacks remain plain text instead of presenting a dead action. Captured call sites separate a compact Type.Method() identity from the file and line, and keep the source action on the same row; stale asset paths remain readable without a dead button. Select a live component to use Select receiver and reveal its exact MessagingComponent in the Hierarchy and Inspector. A selected route also offers Select receiver plus Select source or Select target when its captured context object is still alive. Destroyed and synthetic snapshot objects do not render these actions. The graph does not invent a sender object because targeted emission APIs carry a target, not a sender. Global accept-all registrations appear as GLOBAL OBSERVER / ANY MESSAGE with the amber observer badge, and their details list the concrete message types observed in recent trace evidence. Drag to pan, scroll to zoom, and select a node or connection to inspect it. Use -, Fit, and + when a mouse wheel is unavailable. Automatic framing can zoom out to 20 percent for a useful overview of large graphs; zoom back in or pan before selecting closely spaced items. The canvas renders every filtered message, receiver, and route instead of moving extra message types into a text overflow list.
The window opens without selecting a node or route, so the canvas leads without a details wall. The selected item inspector sits directly below the canvas only after an intentional selection. Route selections show the route path and activity metrics first; emission evidence and diagnostics start collapsed. Diagnostics split route health from trace coverage. For component and message selections, their distinct busiest route and trace path use bordered, directed relationship records with compact message and receiver identities instead of report sentences. Their role, identity, and activity text use primary and secondary text treatments instead of the smaller muted card-caption style. Select either endpoint to move to that message or receiver. Captured context breadcrumbs become links only when diagnostics retained the exact Unity-object-to-component identity and that component is visible in the filtered graph; ambiguous, destroyed, or filtered-out contexts remain text. Message details also provide a collapsed Route roster; expand it to see each receiver and stable receiver ID, exact registration subtype, route context, and context ID, then select any exact route. Receiver and context IDs distinguish The first eight rows appear immediately; larger rosters keep the remainder behind a nested disclosure. A selected route already shows that relationship above its evidence, so its diagnostics omit redundant aggregate relationship records. Use Copy diagnostics to copy the complete newline-oriented report without rendering it in the window. Opening evidence or diagnostics remains stable when background source indexing refreshes the selected item. Expand Analysis and Raw Data only when you need the textual route map, message and target lanes, trace activity, or topology lists. Inside that section, concrete routes sort before GlobalAcceptAll; call volume, recent traced deliveries, and stable names determine the remaining order. The textual route map keeps its first eight rows outside its nested more routes foldout, but the graph itself has no eight-route cap.
If the snapshot sees components or messages but no registration routes, the window explains how to recover: enter Play mode, restart Play mode if it is already active, enable the listeners, and refresh. It does not render a list of zero-value topology summaries.
The graph aggregates:
- component nodes,
- message-type nodes,
- registration edges by message type, target component, registration kind, and source or target context where applicable,
- recent component- and registration-exact delivery call sites for broadcast and targeted edges when token diagnostics captured them,
- route-map call shares,
- visible message lanes by message type,
- visible target lanes by target component,
- visible trace route-kind lanes by traced registration kind,
- visible trace message lanes by traced message type,
- visible trace target lanes by traced target component,
- visible trace-id lanes by positive trace id,
- visible trace context lanes by normalized context,
- recent global and listener-local emission evidence,
- exact recent traced delivery counts per registration edge,
- recent trace-path/context evidence when diagnostics captured token delivery records with positive trace ids.
The graph supports filtering, pan and zoom, automatic framing, stable node and edge selection, details for selected components/messages/routes, and Copy JSON export. The collapsed Visible Message Lanes panel groups visible registration edges by message type, then reports route count, distinct target count, registration count, calls, recent traced deliveries, no-call routes, route kinds, call share, target paths, and inactive target breadth for each lane. The Visible Target Lanes panel groups visible registration edges by target component, then reports route count, distinct message count, registration count, calls, recent traced deliveries, no-call routes, route kinds, call share, target id, active state, and message list for each lane. The Visible Flow Corridors panel groups visible trace paths by message and target component, then reports path count, context count, trace-id count, route kinds, traced deliveries, and delivery share for each corridor. The Visible Trace Route Kind Lanes panel groups visible trace paths by traced registration kind, then reports path count, distinct message, target, and normalized context counts, distinct trace-id count, traced deliveries, delivery share, message list, target list, and normalized context list for each route kind lane. Blank registration kinds collapse into <unknown route kind> so legacy or malformed trace-path evidence remains visible. The Visible Trace Id Lanes panel groups visible trace paths by positive trace id, then reports path-membership count, distinct message, target, and normalized context counts, route kinds, path-membership share, message list, target list, and normalized context list for each trace id lane. It intentionally uses path memberships rather than delivery shares because the trace-path aggregate records which positive trace ids touched a path, not per-trace-id delivery volume. The Visible Trace Message Lanes panel groups visible trace paths by traced message type, then reports path count, normalized context count, distinct target count, distinct trace-id count, route kinds, traced deliveries, delivery share, normalized context list, and target list for each trace message lane. The Visible Trace Target Lanes panel groups visible trace paths by traced target component, then reports path count, distinct message and normalized context counts, distinct trace ids, route kinds, traced deliveries, delivery share, message list, and normalized context list for each trace target lane. The Visible Trace Context Lanes panel groups visible trace paths by normalized trace context, then reports path count, distinct message and target counts, distinct trace ids, route kinds, traced deliveries, delivery share, message list, and target list for each context lane. The expanded Route Insights summary reports the visible route-kind mix, the widest visible message by distinct target components, the target component with the most visible inbound routes, inactive routed targets, the hottest visible route by call share, and visible routes with no calls. It also reports how many visible routes have at least one recent traced delivery and which visible route accounts for the largest share of recent traced deliveries, plus which visible message accounts for the largest share of recent route-edge traced deliveries and which visible target accounts for the largest share. Both the Route Insights and Recent Trace Paths summaries report the visible trace context count, busiest context by recent traced deliveries, distinct visible trace ids, widest visible trace id by path count, and busiest visible trace message, target, and trace path plus each one's trace-path delivery share. The Message Lanes, Target Lanes, and Route Map route-kind, route, call, target-component fan-out, target fan-in, inactive routed-target, no-call, recent traced-route, and recent-traced delivery counts remain scoped to the visible routes while corridor, trace-id-lane, trace-message-lane, trace-target-lane, context-lane, and trace message/target/path summaries remain scoped to visible trace paths. Selected component and message details include route-health counts for traced routes, routes with no calls, and the busiest traced route by visible route-edge delivery share. Selected component details also name the busiest traced message, and selected message details name the busiest traced target from their visible route-edge traced deliveries. They also report the selected component or message share of visible recent route-edge traced deliveries. Selected component, message, and route details also list matching trace contexts, report context count and busiest context volume, group recent traced deliveries by context, report the busiest context's share of their matching trace-path deliveries, show matching trace-id breadth, name the busiest matching trace path, and report that path's delivery share so you can see which captured source/target context accounts for the matching trace-path delivery volume. Selected component details also name the busiest trace message and its matching trace-path delivery share, and selected message details name the busiest trace target and its matching trace-path delivery share. Selected route details also report the exact route's share of visible recent route-edge traced deliveries. The current export uses schemaVersion: 6, captureMode set to registration-topology-with-recent-diagnostics, and a traceSemantics field that explains how trace ids, per-trace-path trace-id counts, and exact per-trace-path trace-id arrays are interpreted. Message rows include semantic kind, recent call sites, and recent contexts. Edge rows include exact route context identity and recent component- and registration-scoped call sites. contextId is the captured Unity instance ID for a source or target; 0 means that the route has no specific source or target context. These IDs distinguish same-named objects inside one capture, but they are local to the running Unity session and are not durable identifiers. If the Unity context object was destroyed after registration, the graph preserves the route and displays Instance <id>. Trace-path rows use the same contextId convention.
Trace paths are recent evidence aggregates built from token-side delivery records that carry a positive traceId. They group by concrete delivered message type, context, target component, and registration type. They are not a durable producer-to-consumer architecture model; records created manually or outside a concrete MessageBus dispatch have traceId = 0 and cannot participate in a trace path. The widest-trace summary counts visible paths that share a positive numeric trace id; it is recent captured-record evidence, not a durable bus-identity guarantee.
RegistrationLog API
The RegistrationLog class tracks all messaging registrations and deregistrations for a message bus. This is invaluable for debugging subscription issues and understanding message flow.
Properties
| Property | Type | Description |
|---|---|---|
Enabled | bool | Get/set whether logging is active. Disabled by default for performance. |
Registrations | IReadOnlyList<MessagingRegistration> | Read-only access to all logged registrations. |
Methods
Log(MessagingRegistration registration)
Records a registration event. Called automatically by the message bus when Enabled is true.
GetRegistrations(InstanceId instanceId)
Returns all registrations for a specific instance. Useful for inspecting what a particular component has registered for.
using DxMessaging.Core;
using DxMessaging.Core.MessageBus;

IMessageBus bus = MessageHandler.MessageBus;
bus.Log.Enabled = true;

// After some registrations occur...
InstanceId myComponent = GetComponent<MonoBehaviour>();
foreach (MessagingRegistration reg in bus.Log.GetRegistrations(myComponent))
{
    Debug.Log($"Registered for {reg.type.Name} via {reg.registrationMethod}");
}
ToString() and ToString(Func<MessagingRegistration, string> serializer)
Returns a string representation of all logged registrations. You can provide a custom serializer for formatted output.
using DxMessaging.Core;
using DxMessaging.Core.MessageBus;

IMessageBus bus = MessageHandler.MessageBus;
bus.Log.Enabled = true;

// ... after some registrations/deregistrations
Debug.Log(bus.Log.ToString());

// Custom formatting
string formatted = bus.Log.ToString(reg =>
    $"[{reg.registrationType}] {reg.type.Name} @ {reg.time:F2}s"
);
Debug.Log(formatted);
Clear(Predicate<MessagingRegistration> shouldRemove = null)
Removes registrations from the log. Pass null to clear all, or provide a predicate to selectively remove entries.
using DxMessaging.Core;
using DxMessaging.Core.MessageBus;

IMessageBus bus = MessageHandler.MessageBus;

// Clear all registrations
int cleared = bus.Log.Clear();

// Clear only deregistrations
int deregistrationsCleared = bus.Log.Clear(
    reg => reg.registrationType == RegistrationType.Deregister
);
MessagingRegistration Struct
Each logged registration is stored as a MessagingRegistration struct containing:
| Field | Type | Description |
|---|---|---|
id | InstanceId | The handler's unique identifier. |
type | Type | The message type being registered for. |
registrationType | RegistrationType | Whether this was a Register or Deregister event. |
registrationMethod | RegistrationMethod | The exact registration category (Targeted, Broadcast, etc.). |
time | float | Unity time when the registration occurred (Unity only). |
RegistrationMethod Values
The RegistrationMethod enum captures how the handler was wired up:
Targeted-- Bound to a specific recipientUntargeted-- Global untargeted handlerBroadcast-- Bound to a specific sourceBroadcastWithoutSource-- Broadcast handler without explicit sourceTargetedWithoutTargeting-- Targeted handler ignoring runtime targetGlobalAcceptAll-- Catch-all handlerInterceptor-- Message interceptorUntargetedPostProcessor,TargetedPostProcessor,BroadcastPostProcessor-- Post-processorsTargetedWithoutTargetingPostProcessor-- Post-processor for targeted messages ignoring runtime targetBroadcastWithoutSourcePostProcessor-- Post-processor for broadcasts without explicit source
Emission History
When diagnostics are enabled, buses and tokens record message emissions in a ring buffer:
- Buffer size is controlled by
IMessageBus.GlobalMessageBufferSize(default: 100). - Emission-site stack traces are captured only when
IMessageBus.GlobalDiagnosticsStackTracesis on; see Emission-Site Capture. - Setting buffer size to 0 disables history retention (emissions are silently discarded).
- Inspect recent emissions per token via built-in diagnostics or build custom tools using post-processors.
- Bus-side
MessageBusrecords carry a non-zerotraceIdwhile dispatching. - Token-side records carry the observing
registrationHandleand, when the delivery happened during a concrete bus dispatch, the same non-zerotraceId. - Manually-created records and legacy direct handler dispatches keep
traceId = 0; tools treat those as local evidence only.
using DxMessaging.Core.MessageBus;

// Increase buffer size for more history
IMessageBus.GlobalMessageBufferSize = 500;
Logging Integration
Integrate DxMessaging with your logging framework:
using DxMessaging.Core;

MessagingDebug.enabled = true;
MessagingDebug.LogFunction = (level, msg) =>
    UnityEngine.Debug.Log($"[DxMessaging:{level}] {msg}");
Per-Environment Configuration
A common pattern is enabling diagnostics only in the Editor for development visibility while keeping runtime builds lean.
Editor-Only Diagnostics
using DxMessaging.Core.MessageBus;

// Enable diagnostics only when running in the Unity Editor
IMessageBus.GlobalDiagnosticsTargets = DiagnosticsTarget.Editor;
This is the recommended default for most projects. You get full visibility during development without any performance cost in production builds. Leave emission-site capture off unless you are actively tracing a call site; see Emission-Site Capture.
Runtime Diagnostics for QA Builds
For QA or debug builds where you need diagnostics in the player:
using DxMessaging.Core.MessageBus;

#if DEVELOPMENT_BUILD || UNITY_EDITOR
IMessageBus.GlobalDiagnosticsTargets = DiagnosticsTarget.All;
#else
IMessageBus.GlobalDiagnosticsTargets = DiagnosticsTarget.Off;
#endif
Conditional Logging Based on Build Type
using DxMessaging.Core;
using DxMessaging.Core.MessageBus;

public static class DiagnosticsBootstrap
{
    [RuntimeInitializeOnLoadMethod(RuntimeInitializeLoadType.BeforeSceneLoad)]
    private static void Initialize()
    {
#if UNITY_EDITOR
        IMessageBus.GlobalDiagnosticsTargets = DiagnosticsTarget.Editor;
        IMessageBus.GlobalMessageBufferSize = 200;
        MessageHandler.MessageBus.Log.Enabled = true;
#elif DEVELOPMENT_BUILD
        IMessageBus.GlobalDiagnosticsTargets = DiagnosticsTarget.Runtime;
        IMessageBus.GlobalMessageBufferSize = 50;
#else
        IMessageBus.GlobalDiagnosticsTargets = DiagnosticsTarget.Off;
#endif
    }
}
Performance Considerations
Diagnostics add overhead. Consider these factors when enabling them:
Memory Impact
- Each
MessagingRegistrationstruct consumes memory for the registration log. - The emission ring buffer stores
MessageEmissionDatarecords (controlled byGlobalMessageBufferSize). - Larger buffer sizes consume more memory but provide more history.
CPU Impact
- Registration logging adds overhead to every
RegisterandDeregistercall. - Emission recording adds overhead to every message broadcast.
- Post-processor chains for diagnostics run after each message dispatch.
Emission-Site Capture
MessageEmissionData.stackTrace holds the call site an emission came from, and it is what the Message Monitor and Flow Graph Open buttons resolve into source links. Capturing it means walking and formatting the managed stack on every diagnostic record, which is expensive enough to dominate a frame:
| Measurement (Unity 6000.4.6f1, Editor PlayMode Mono x64 Release) | Value |
|---|---|
| Cost of one captured record | ~236 microseconds |
| Allocation calls per captured record | ~67 |
| Records written per single-subscriber emission | 2 (bus plus token) |
Comparison_DxMessaging_GlobalToOne with capture on | ~1,100 emissions/sec |
| Same row with a plain C# event, same session | ~340,000,000/sec |
Capture cost scales with stack depth, so deeper gameplay call stacks pay more. Because of that, capture is off by default.
The editor tells you when that is why a call site is missing, and offers the switch on the spot: the Message Monitor's Stack trace disclosure reads Stack trace (capture off), opens itself, explains the trade-off, and carries an Enable stack traces button; the Flow Graph's emission-site rows read none captured (capture off) and carry the same button. Clicking it takes effect for the next emission and is saved to the project settings asset. Rows already recorded stay empty, because their call site was never captured.
You can also set it from code or from the settings page:
using DxMessaging.Core.MessageBus;

// Only while tracing where a message came from.
IMessageBus.GlobalDiagnosticsStackTraces = true;
In the editor, the same switch is Project Settings > Wallstop Studios > DxMessaging > Capture Emission Stack Traces, which is also where you turn it back off. With it off, every other part of diagnostics still works: emission history, call counts, trace ids, registration logs, the Message Monitor log, and the Flow Graph. Only the per-row stack trace and its source links are empty.
Recommendations
| Environment | Recommended Setting | Buffer Size |
|---|---|---|
| Development/Editor | DiagnosticsTarget.Editor | 100-200 |
| QA/Debug Builds | DiagnosticsTarget.All | 50-100 |
| Release Builds | DiagnosticsTarget.Off | N/A |
| Automated Tests | DiagnosticsTarget.All + Log.Enabled | 100 |
using DxMessaging.Core.MessageBus;

// Production-safe defaults
IMessageBus.GlobalDiagnosticsTargets = DiagnosticsTarget.Off;
IMessageBus.GlobalMessageBufferSize = 0; // No history retention
Editor Integration (Inspector)
Attach MessagingComponent to a GameObject. In the Unity Inspector:
- Enable/Disable Global Diagnostics: Toggles bus-wide recording.
- Global Buffer: Paged view of recent emissions (type and context). Matching listeners are highlighted.
- Local Buffer: Per-listener ring buffer; enable per-token diagnostics to populate.
- Registrations: Paged list of what each listener registered for (type, priority, context).
Tips
- Turn on diagnostics while developing; turn off for release builds if you don't need runtime recording.
- Use Message Monitor when you need the latest global bus emissions and stack traces.
- Use Flow Graph when you need registration topology, route-map call shares, route-kind mix, widest target-component fan-out, hottest visible routes, most-routed targets, inactive routed-target hints, no-call route hints, visible traced-route coverage, busiest traced-route, traced-message, and traced-target share, visible trace route-kind lanes, visible trace message lanes, visible trace target lanes, visible trace-id lanes, visible trace context volume and share, visible trace context lanes, visible trace-id breadth, visible flow corridors, visible trace-message/target/path concentration, selected component/message route-health and busiest traced-route details, selected component busiest traced-message details, selected message busiest traced-target details, selected component trace-message and selected message trace-target details, selected component/message/route visible traced-share details, selected component/message/route trace context volume and deliveries, busiest-context shares, trace-id breadth, busiest paths, and busiest-path shares, and recent trace-path evidence, including distinct trace-id counts, widest visible trace ids, busiest trace-message, trace-target, and trace-path shares, for loaded scene components.
- Use
RegisterTargetedWithoutTargetingorRegisterBroadcastWithoutSourcefor custom monitoring dashboards. - Set
Log.Enabled = truein tests to verify registration behavior. - Use
Log.Clear()between test cases to isolate registration tracking.
Memory diagnostic counters
Three pieces of API expose memory-reclamation state on IMessageBus:
OccupiedTypeSlotsreturns the number of distinct per-message-type slots currently occupied on the bus.OccupiedTargetSlotsreturns the number of distinct target or source context slots currently occupied on the bus.Trim(bool force = false)reclaims empty slots and returns aTrimResultwhoseTypeSlotsEvicted,TargetSlotsEvicted,PooledCollectionsEvicted, andLiveTypeSlotsRemainingfields describe the work performed.MessageHandler.TrimAll(force)is the convenience wrapper for the global bus.
The counters are calculated when read. Snapshot them at useful boundaries, such as before and after unloading a gameplay area, instead of polling every frame. To check whether a scoped operation left registrations behind:
- Snapshot
OccupiedTypeSlotsandOccupiedTargetSlotsat the start of a scoped operation. - Run the operation.
- Call
Trim(force: true)to reset every empty slot. - Compare the post-trim counters against the snapshot.
An increase after trimming means the bus still has live registrations or other occupied routing state. Use Message Monitor or Flow Graph to find the owners before deciding that the increase is a leak.
For the full reclamation model, tuning recommendations, and worked examples, see the Memory Reclamation guide.